Record 8.5% of U.S. Homes Worth $1M or More - Housing Market Update
Original Source Redfin
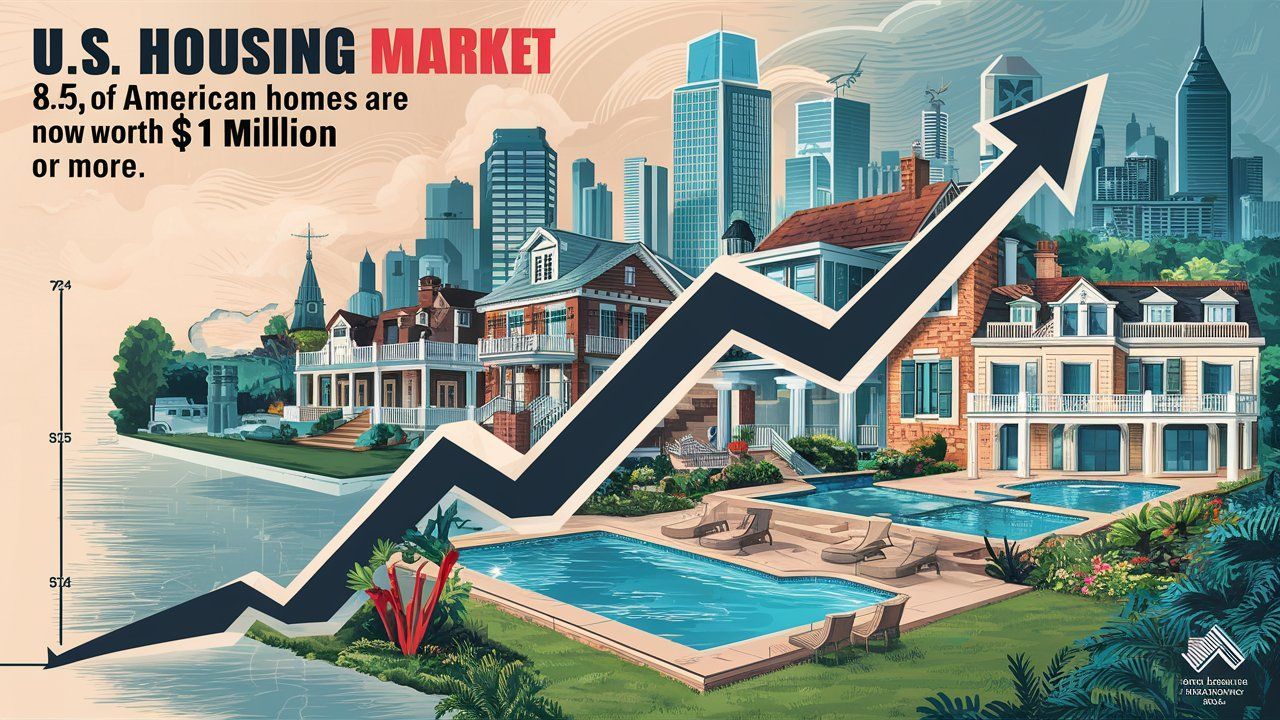
Record 8.5% of U.S. Homes Are Now Worth $1 Million or More
Despite high mortgage rates reducing demand, the U.S. housing market continues to see home values rise due to historically low inventory. Nearly one in ten (8.5%) U.S. homes are now valued at $1 million or more—a record high. This is up from 7.6% last year and more than double the pre-pandemic share of 4%. This increase in million-dollar homes is driven by rising home prices, with the median sale price nationwide increasing by 4% year-over-year in June. Even as the pace of price growth has slowed in 2024, prices have consistently risen over the past year, pushing more homes over the million-dollar mark. Luxury homes, in particular, have seen significant gains, with their median sale price climbing 9% to $1.18 million in the second quarter of 2024.
Supply Shortage Keeps Prices High
While high mortgage rates have led to slower homebuying demand, a shortage in housing supply has kept prices elevated. Many homeowners are holding onto their properties due to locked-in low mortgage rates, further reducing inventory. Although there has been a slight improvement in inventory levels, it remains about 30% below pre-pandemic levels, leading to competition among buyers and keeping prices high. For homeowners, the increasing value of their properties is a financial boon, potentially boosting their real estate portfolios or providing substantial returns upon selling. However, for prospective buyers, especially first-time buyers, the rising number of million-dollar homes poses a significant affordability challenge.
Regional Trends: California Leads the Way
California continues to dominate the market with the highest concentration of million-dollar homes. In Anaheim, 58.8% of homes are now valued at $1 million or more, up from 51% last year. San Diego and Los Angeles have also seen substantial increases, with 42.6% and 39.3% of homes, respectively, now worth over a million dollars.
The Bay Area remains the most expensive region, with roughly 80% of homes in San Francisco and San Jose valued at $1 million or more, the highest in the country. In contrast, more affordable metro areas like Detroit, Cleveland, and Pittsburgh have less than 1% of homes valued at seven figures.
Conclusion
The growing number of million-dollar homes reflects the ongoing challenges in the U.S. housing market, where low inventory continues to drive up prices despite higher mortgage rates. While this trend benefits current homeowners, it creates hurdles for buyers, especially in high-demand areas like California.
For those navigating this competitive market, it’s crucial to stay informed and explore all options. If you're a mortgage loan originator or considering a career in the mortgage industry, check out Innovative Mortgage’s Compensation Plans to learn how we can help you succeed.
| U.S. Metro Area | Share of Homes Worth $1M+ (June 2024) | Share of Homes Worth $1M+ (June 2023) | Year-Over-Year Change (Percentage Points) |
|---|---|---|---|
| Anaheim, CA | 58.8% | 51.0% | +7.8 |
| Atlanta, GA | 4.6% | 4.1% | +0.5 |
| Austin, TX | 10.0% | 10.1% | -0.1 |
| Baltimore, MD | 3.6% | 3.1% | +0.5 |
| Boston, MA | 23.8% | 20.6% | +3.2 |
| Charlotte, NC | 4.9% | 4.3% | +0.6 |
| Chicago, IL | 3.7% | 3.1% | +0.6 |
| Cincinnati, OH | 1.5% | 1.2% | +0.3 |
| Cleveland, OH | 0.8% | 0.7% | +0.1 |
| Columbus, OH | 1.5% | 1.2% | +0.3 |
| Dallas, TX | 6.4% | 6.2% | +0.2 |
| Denver, CO | 11.3% | 10.9% | +0.4 |
| Detroit, MI | 0.5% | 0.4% | +0.1 |
| Fort Lauderdale, FL | 7.7% | 7.1% | +0.6 |
| Fort Worth, TX | 3.3% | 3.2% | +0.1 |
| Houston, TX | 3.6% | 3.6% | 0.0 |
| Indianapolis, IN | 2.0% | 2.0% | 0.0 |
| Jacksonville, FL | 4.6% | 4.4% | +0.2 |
| Kansas City, MO | 0.9% | 0.8% | +0.1 |
| Las Vegas, NV | 3.9% | 3.3% | +0.6 |
| Los Angeles, CA | 39.3% | 35.0% | +4.3 |
| Miami, FL | 14.8% | 13.3% | +1.5 |
| Milwaukee, WI | 2.0% | 1.6% | +0.4 |
| Minneapolis, MN | 2.8% | 2.5% | +0.3 |
| Montgomery County, PA | 5.1% | 4.3% | +0.8 |
| Nashville, TN | 7.7% | 7.2% | +0.5 |
| Nassau County, NY | 19.2% | 17.2% | +2.0 |
| New Brunswick, NJ | 12.0% | 9.2% | +2.8 |
| New York, NY | 30.5% | 27.0% | +3.5 |
| Newark, NJ | 12.4% | 9.6% | +2.8 |
|---|---|---|---|
| Oakland, CA | 48.1% | 45.9% | +2.2 |
| Orlando, FL | 3.6% | 3.3% | +0.3 |
| Philadelphia, PA | 2.6% | 2.3% | +0.3 |
| Phoenix, AZ | 7.4% | 6.7% | +0.7 |
| Pittsburgh, PA | 0.9% | 0.8% | +0.1 |
| Portland, OR | 7.3% | 6.9% | +0.4 |
| Providence, RI | 3.0% | 2.3% | +0.7 |
| Riverside, CA | 7.2% | 6.2% | +1.0 |
| Sacramento, CA | 8.9% | 7.9% | +1.0 |
| San Antonio, TX | 2.3% | 2.2% | +0.1 |
| San Diego, CA | 42.6% | 36.5% | +6.1 |
| San Francisco, CA | 80.6% | 76.4% | +4.2 |
| San Jose, CA | 80.1% | 76.3% | +3.8 |
| Seattle, WA | 34.4% | 30.2% | +4.2 |
| St. Louis, MO | 1.3% | 1.1% | +0.2 |
| Tampa, FL | 5.1% | 4.8% | +0.3 |
| Virginia Beach, VA | 3.1% | 2.6% | +0.5 |
| Warren, MI | 1.7% | 1.4% | +0.3 |
| Washington, DC | 13.1% | 11.1% | +2.0 |
| West Palm Beach, FL | 14.2% | 13.0% | +1.2 |
Are you a mortgage originator looking for more support and better compensation? Interview us today and see if Innovative Mortgage Services, Inc. is a good fit for you.


